
Most small and mid-sized manufacturers maintain their equipment the same way they always have: on a fixed calendar. Every machine gets serviced every few weeks, whether it needs it or not. It feels disciplined. In practice, it quietly wastes effort on healthy machines while under-protecting the ones that actually decide whether the production line runs.
For an automotive component OEM we recently worked with, that gap wasn’t just inefficient — under IATF 16949, it was a compliance risk. Here is how we helped them shift from calendar-based maintenance to evidence-based maintenance, and why the humble Pareto chart sat at the centre of it.
The problem: a stretched maintenance team and a fixed schedule
The client’s maintenance team was capable but stretched thin. Their preventive maintenance ran on a uniform calendar — every piece of equipment treated more or less equally. The result was a familiar pattern: some machines were serviced far more often than they needed, while a handful of critical machines kept causing unplanned downtime between scheduled visits.
In an automotive supply chain governed by IATF 16949, unplanned downtime on the wrong machine doesn’t just cost production hours. It threatens delivery commitments and, ultimately, conformity of the product itself.
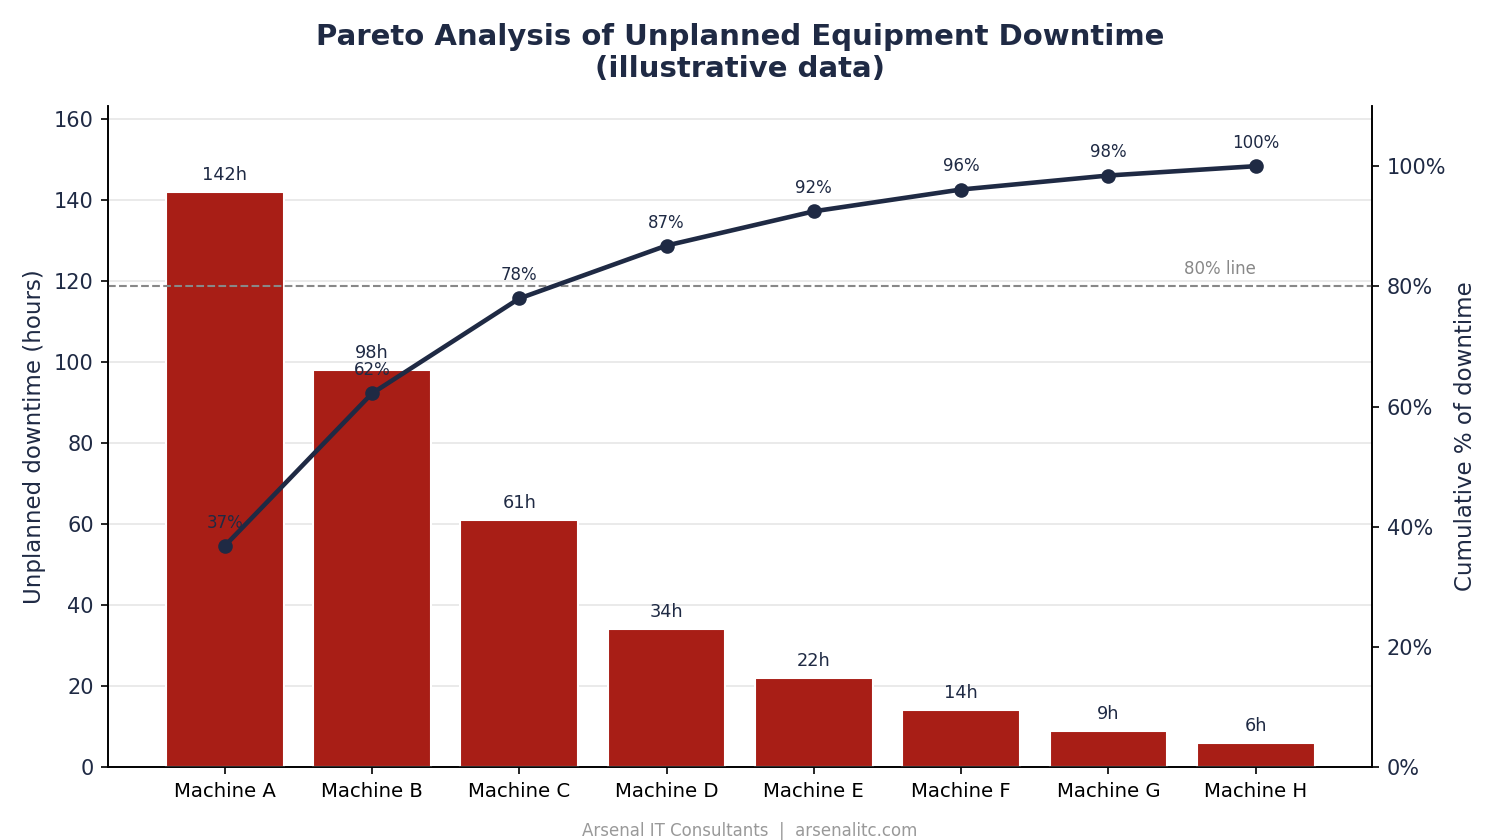
The method: let the data decide with a Pareto chart
The Pareto principle — the idea that roughly 80% of effects come from 20% of causes — is one of the oldest tools in quality management, and it is perfectly suited to maintenance.
We pulled the client’s equipment breakdown and downtime history and built Pareto charts from it: each machine (or failure mode) ranked by its contribution to total unplanned downtime, with a cumulative line laid over the bars. The picture was textbook. A small group of machines was responsible for the overwhelming majority of stoppages. Those were the “vital few.” The rest were the “trivial many.”
This is the step most operations skip. Plenty of factories collect breakdown data. Far fewer turn it into a ranked, visual decision aid that tells you exactly where to spend your maintenance hours.
The bridge: mapping the Pareto onto the maintenance schedule
A chart on its own changes nothing. The value came from connecting it to action. We mapped the Pareto output directly onto the preventive maintenance schedule:
- The vital few machines moved to tighter, condition-based maintenance intervals, with closer monitoring of the failure modes that were actually causing stoppages.
- The trivial many shifted to leaner cycles, freeing up technician hours without raising risk.
In short, maintenance effort started following the risk instead of the calendar.
Why this satisfies IATF 16949
IATF 16949 Clause 8.5.1.5 requires a documented Total Productive Maintenance (TPM) system, with maintenance objectives measured through metrics such as OEE (Overall Equipment Effectiveness), MTBF (Mean Time Between Failures) and MTTR (Mean Time To Repair), along with predictive maintenance methods where applicable.
A Pareto-driven schedule supports those requirements directly. It provides documented, data-based justification for why equipment is maintained at the intervals it is — exactly the kind of evidence auditors look for. And by concentrating effort on the machines that drive downtime, it moves the MTBF and OEE numbers on the equipment that matters most to the line.
The takeaway
In a quality-critical operation, maintenance shouldn’t run on a calendar. It should run on the data you already have. The tools to do it — Pareto analysis, clean breakdown data, and the right open-source platform such as Odoo to hold it all — are well within reach of any SMB manufacturer, without a six-figure software bill.
If your maintenance schedule is built on “we’ve always done it every few weeks,” it may be time to let the evidence decide instead.
Arsenal IT Consultants helps SMB manufacturers turn the data they already collect into decisions that improve uptime, quality and compliance. Get in touch to talk about your operation.