
How a “perfectly fine” stored procedure was one growth spurt away from a production incident — and the backend best practices that took it from 505 ms to under 50 ms.
Most SQL Server performance problems don’t announce themselves. They don’t throw errors. They don’t fail a test. The query returns the correct rows, the screen loads, the report prints — and everyone moves on. The code looks fine, so nobody questions it. That is exactly the problem.
Performance doesn’t live in the result set. It lives in the execution plan. And the execution plan is precisely where the most consequential decisions in SQL Server backend programming get quietly ignored — because you have to go looking for them, and most teams never do until something breaks during their busiest week.
We recently ran a performance assessment on a single stored procedure inside a live enterprise HR system. On paper, it was healthy: it ran in 505 milliseconds and returned 131 rows. Nobody had flagged it. But when we decomposed the actual execution plan — operator by operator — we found a query balanced on a knife’s edge, held up entirely by a warm cache and a small table that wouldn’t stay small. Here is what “fine” was actually hiding.
The result set was right. The execution plan was a warning label.
The first thing we did was stop trusting the runtime and start reading the plan. The very first line of diagnostic output told the story: the query optimiser had timed out before it finished searching for a plan. SQL Server’s optimiser works within a time budget. When a query is complex enough — ten joins, a scalar function, a view, cross-database references, a pile of data-type mismatches — the optimiser can run out of time and simply ship the best plan it happened to find so far. Not the best plan. The best plan before the clock ran out.
That single signal reframes everything. It means the 505 ms wasn’t the product of a good plan. It was the product of a rushed one that happened to work because the data was small and already sitting in memory. Underneath it, five classic, entirely avoidable mistakes were compounding.
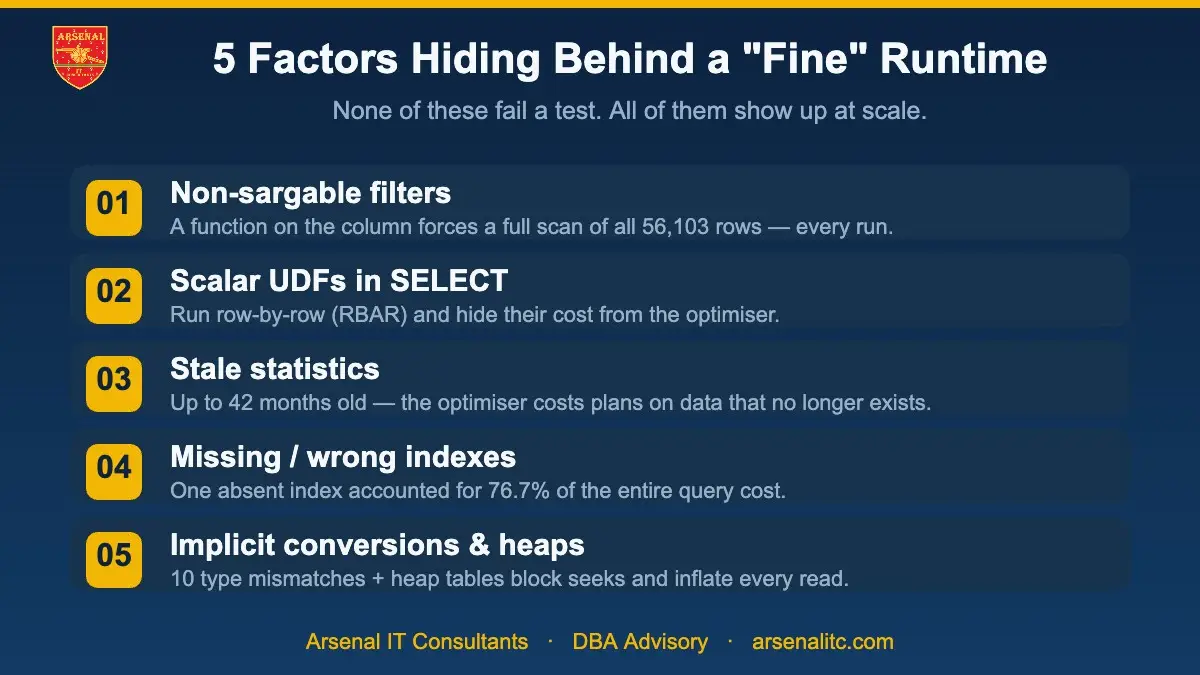
1. A non-sargable filter turning every run into a full scan
The procedure filtered records by date using a function wrapped around the column — CONVERT(DATE, CreatedDate) BETWEEN .... The moment you wrap a column in a function inside a WHERE clause, you make the predicate non-sargable: SQL Server can no longer seek into an index on that column, even if a perfect index exists. It has no choice but to scan the entire table, compute the function on every row, and then filter. The result: a 100% table scan of all 56,103 rows on every single execution — regardless of whether the user asked for one day or one year of data.
2. A scalar function running row-by-row inside the SELECT
The query called a scalar user-defined function in its SELECT list. Scalar UDFs are one of the most expensive habits in T-SQL because they execute once per row and force SQL Server out of fast, set-based processing into row-by-row execution — what the community bluntly calls RBAR, “row by agonising row.” Worse, the optimiser treats the function as a black box: its cost is invisible in the plan, so it looks free right up until concurrency or data volume makes it the dominant bottleneck.
3. Statistics up to 42 months out of date
The optimiser makes every costing decision — which join type, how much memory, seek or scan — based on statistics that describe the shape of your data. On this system, the statistics on one core table hadn’t been updated since December 2022 — over three and a half years. When statistics are that old, the optimiser’s estimates aren’t estimates any more; they’re guesses about a database that no longer exists. Every downstream decision inherits the error.
4. A missing index carrying 76.7% of the cost
The plan’s own missing-index recommendation was unambiguous: a single absent index on a frequently probed table accounted for 76.7% of the entire query’s estimated cost. Nearly four-fifths of the work the server was doing traced back to one index that had never been created.
5. Ten implicit conversions, heap tables, and a dead join
Then the accumulated debt: ten implicit data-type conversions that quietly wreck cardinality estimates and block index seeks; two heap tables with no clustered index, forcing every lookup through an extra I/O step; and a dead join to a table whose only column had been commented out — 7,000 lookups per run, returning exactly zero useful columns. None of this is exotic. Every one is a well-documented anti-pattern. They survive precisely because, individually, none of them breaks anything — and collectively they hide behind a runtime that looks acceptable.
Why “it runs fine” is a trap
The 505 ms measurement was taken under the best possible conditions: a warm cache with the whole table already in memory, and a pre-compiled plan ready to go. Change any of those — restart the server, add memory pressure, evict the plan — and the same procedure has to read that full table from disk. Our cold-cache estimate was 3 to 8 seconds.
And because the design scans the entire table rather than seeking the slice it needs, its cost grows in lockstep with the table. At 56,000 rows it’s tolerable. At 200,000 rows the scan is 3.6x more expensive. At 500,000 rows, 9x. That is the definition of a query that works in the demo and dies in production. It wasn’t slow yet. It was going to be slow, on a schedule set by the company’s own growth.
The fix: best practices, applied in the right order
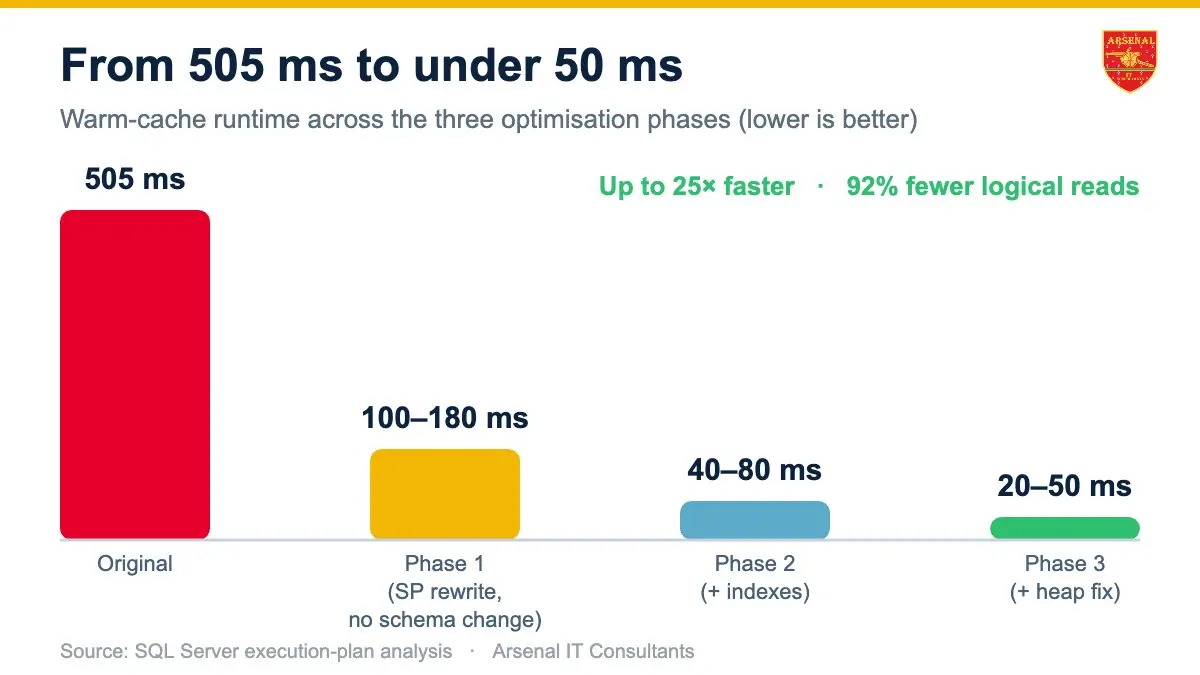
Phase 1 — zero schema changes. Before touching structure, we rewrote the procedure itself. The date filter was made sargable, enabling an index seek. The scalar UDF was pre-materialised in a single set-based batch instead of firing per row. The dead join was deleted. A per-row subquery that hit a three-row table 7,000 times was resolved once into a variable. Every implicit conversion was fixed with an explicit cast. This phase alone, with no change to the database schema at all, cut logical reads by roughly 70% and brought warm-cache runtime into the 100–180 ms range.
Phase 2 — strategic indexing. Three targeted indexes, led by the one carrying 76.7% of the plan cost. Warm-cache runtime dropped to 40–80 ms.
Phase 3 — structural remediation. Converting the largest heap into a properly clustered table and inlining the scalar function. Final warm-cache runtime: 20–50 ms.
The numbers that matter
| Measure | Before | After |
|---|---|---|
| Warm-cache runtime | 505 ms | 20–50 ms (up to 25x faster) |
| Cold-cache runtime | 3–8 seconds | under 150 ms (up to 50x faster) |
| Total logical reads | ~250,000 | ~20,000 (up to 92% fewer) |
| Rows scanned per run | 56,103 (full scan) | ~7,000 (targeted seek) |
| Implicit conversions | 10 | 0 |
But the single most important change isn’t in the table. It’s in the shape of the cost. The old procedure scaled with the size of the whole table. The new one scales only with the date range the user actually asked for. We turned an O(n) problem into an O(k) one — and that is the difference between a system that survives growth and one that quietly counts down to the day it can’t.
What this means for your backend
If your SQL Server databases have never been formally reviewed, the odds are good that something in them is telling the same 505 ms lie: correct results, acceptable-looking runtime, and an execution plan nobody has read. The fixes are rarely dramatic. Sargable predicates, set-based logic, current statistics, correct indexing, clean data types — the fundamentals, applied deliberately — routinely deliver order-of-magnitude gains without rewriting your application.
At Arsenal IT Consultants, our Database (DBA) Advisory practice specialises in exactly this: reading what the execution plan is actually telling you, fixing it in the right order, and putting the governance in place — statistics maintenance, index hygiene, plan monitoring — so it stays fast as you grow. The 505 ms was never the point. The story it was hiding was.